Troubleshooting
This guide covers common troubleshooting techniques for Zed. Sometimes you'll be able to identify and resolve issues on your own using this information. Other times, troubleshooting means gathering the right information (logs, profiles, or reproduction steps) to help us diagnose and fix the problem.
Note: To open the command palette, use
cmd-shift-pon macOS orctrl-shift-pon Windows / Linux.
Retrieve Zed and System Information
When reporting issues or seeking help, it's useful to know your Zed version and system specifications. You can retrieve this information using the following actions from the command palette:
zed: about: Find your Zed version numberzed: copy system specs into clipboard: Populate your clipboard with Zed version number, operating system version, and hardware specszed: copy installed extensions into clipboard: Populate your clipboard with a list of your installed extensions and versions
Zed Log
Often, a good first place to look when troubleshooting any issue in Zed is the Zed log, which might contain clues about what's going wrong.
You can review the most recent 1000 lines of the log by running the zed: open log action from the command palette.
If you want to view the full file, you can reveal it in your operating system's native file manager via zed: reveal log in file manager from the command palette.
You'll find the Zed log in the respective location on each operating system:
- macOS:
~/Library/Logs/Zed/Zed.log - Windows:
C:\Users\YOU\AppData\Local\Zed\logs\Zed.log - Linux:
~/.local/share/zed/logs/Zed.logor$XDG_DATA_HOME
Note: In some cases, it might be useful to monitor the log live, such as when developing a Zed extension. Example:
tail -f ~/Library/Logs/Zed/Zed.log
The log may contain enough context to help you debug the issue yourself, or you may find specific errors that are useful when filing a GitHub issue or when talking to Zed staff in our Discord server.
Performance Issues (Profiling)
If you're running into performance issues in Zed (hitches, hangs, or general unresponsiveness), having a performance profile attached to your issue will help us zero in on what is getting stuck.
macOS
Xcode Instruments (which comes bundled with your Xcode download) is the standard tool for profiling on macOS.
- With Zed running, open Instruments
- Select
Time Profileras the profiling template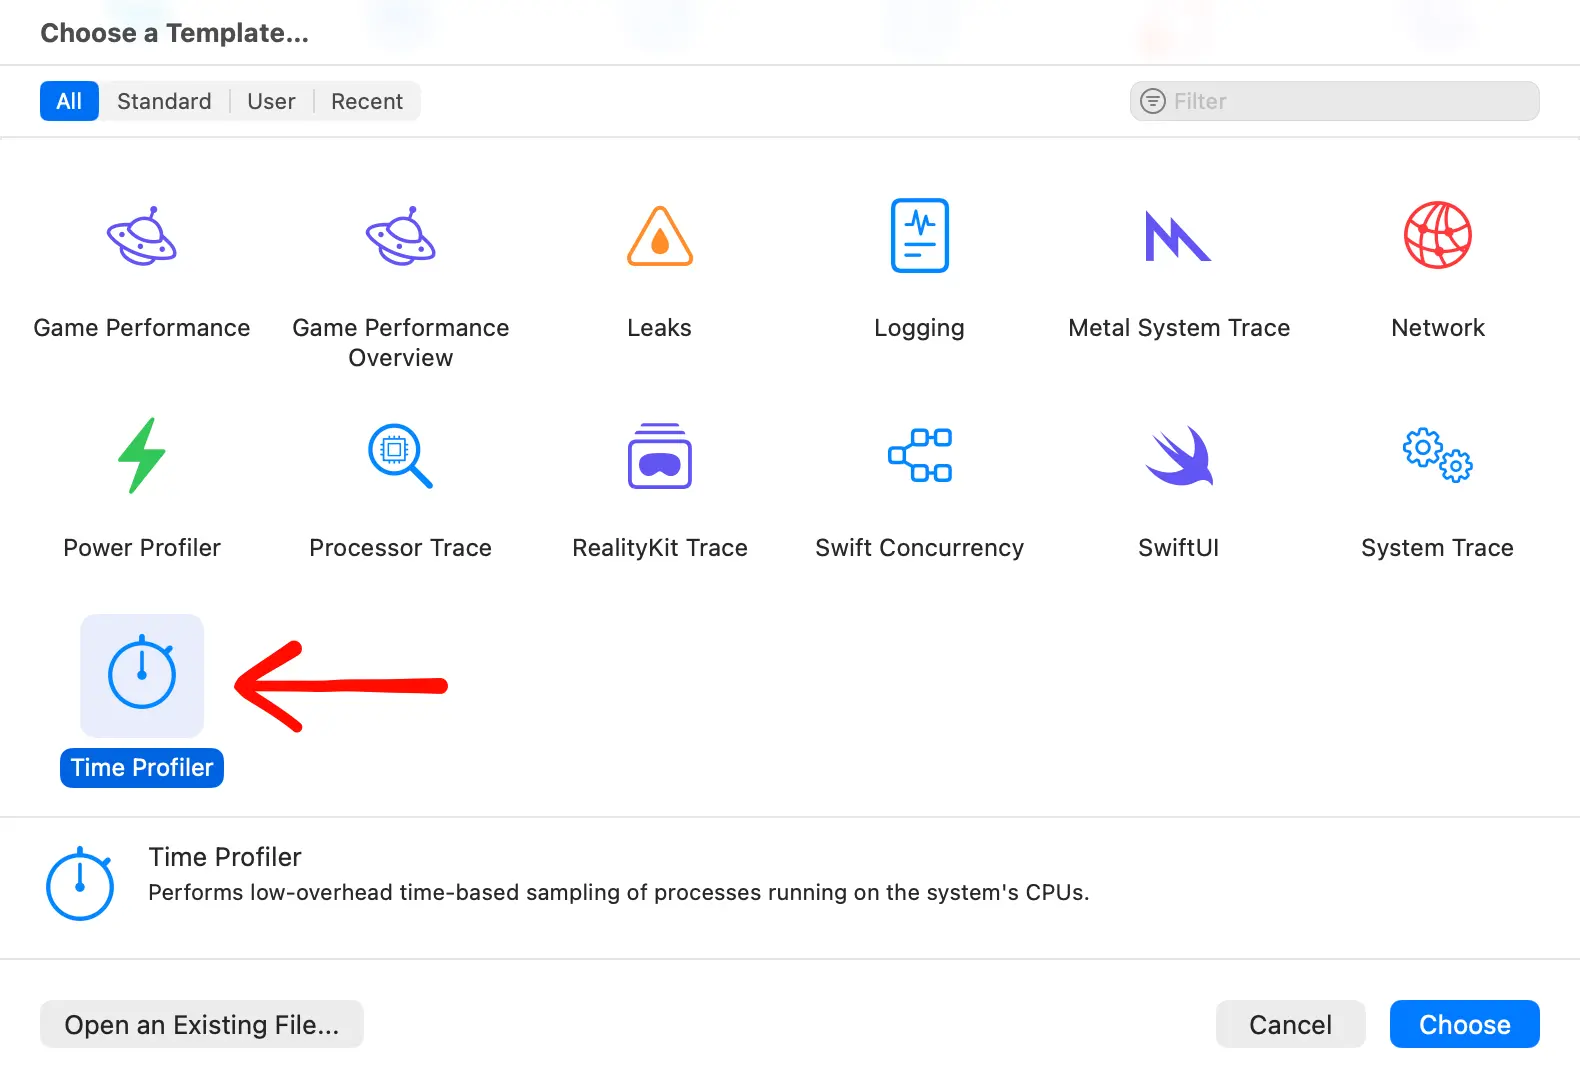
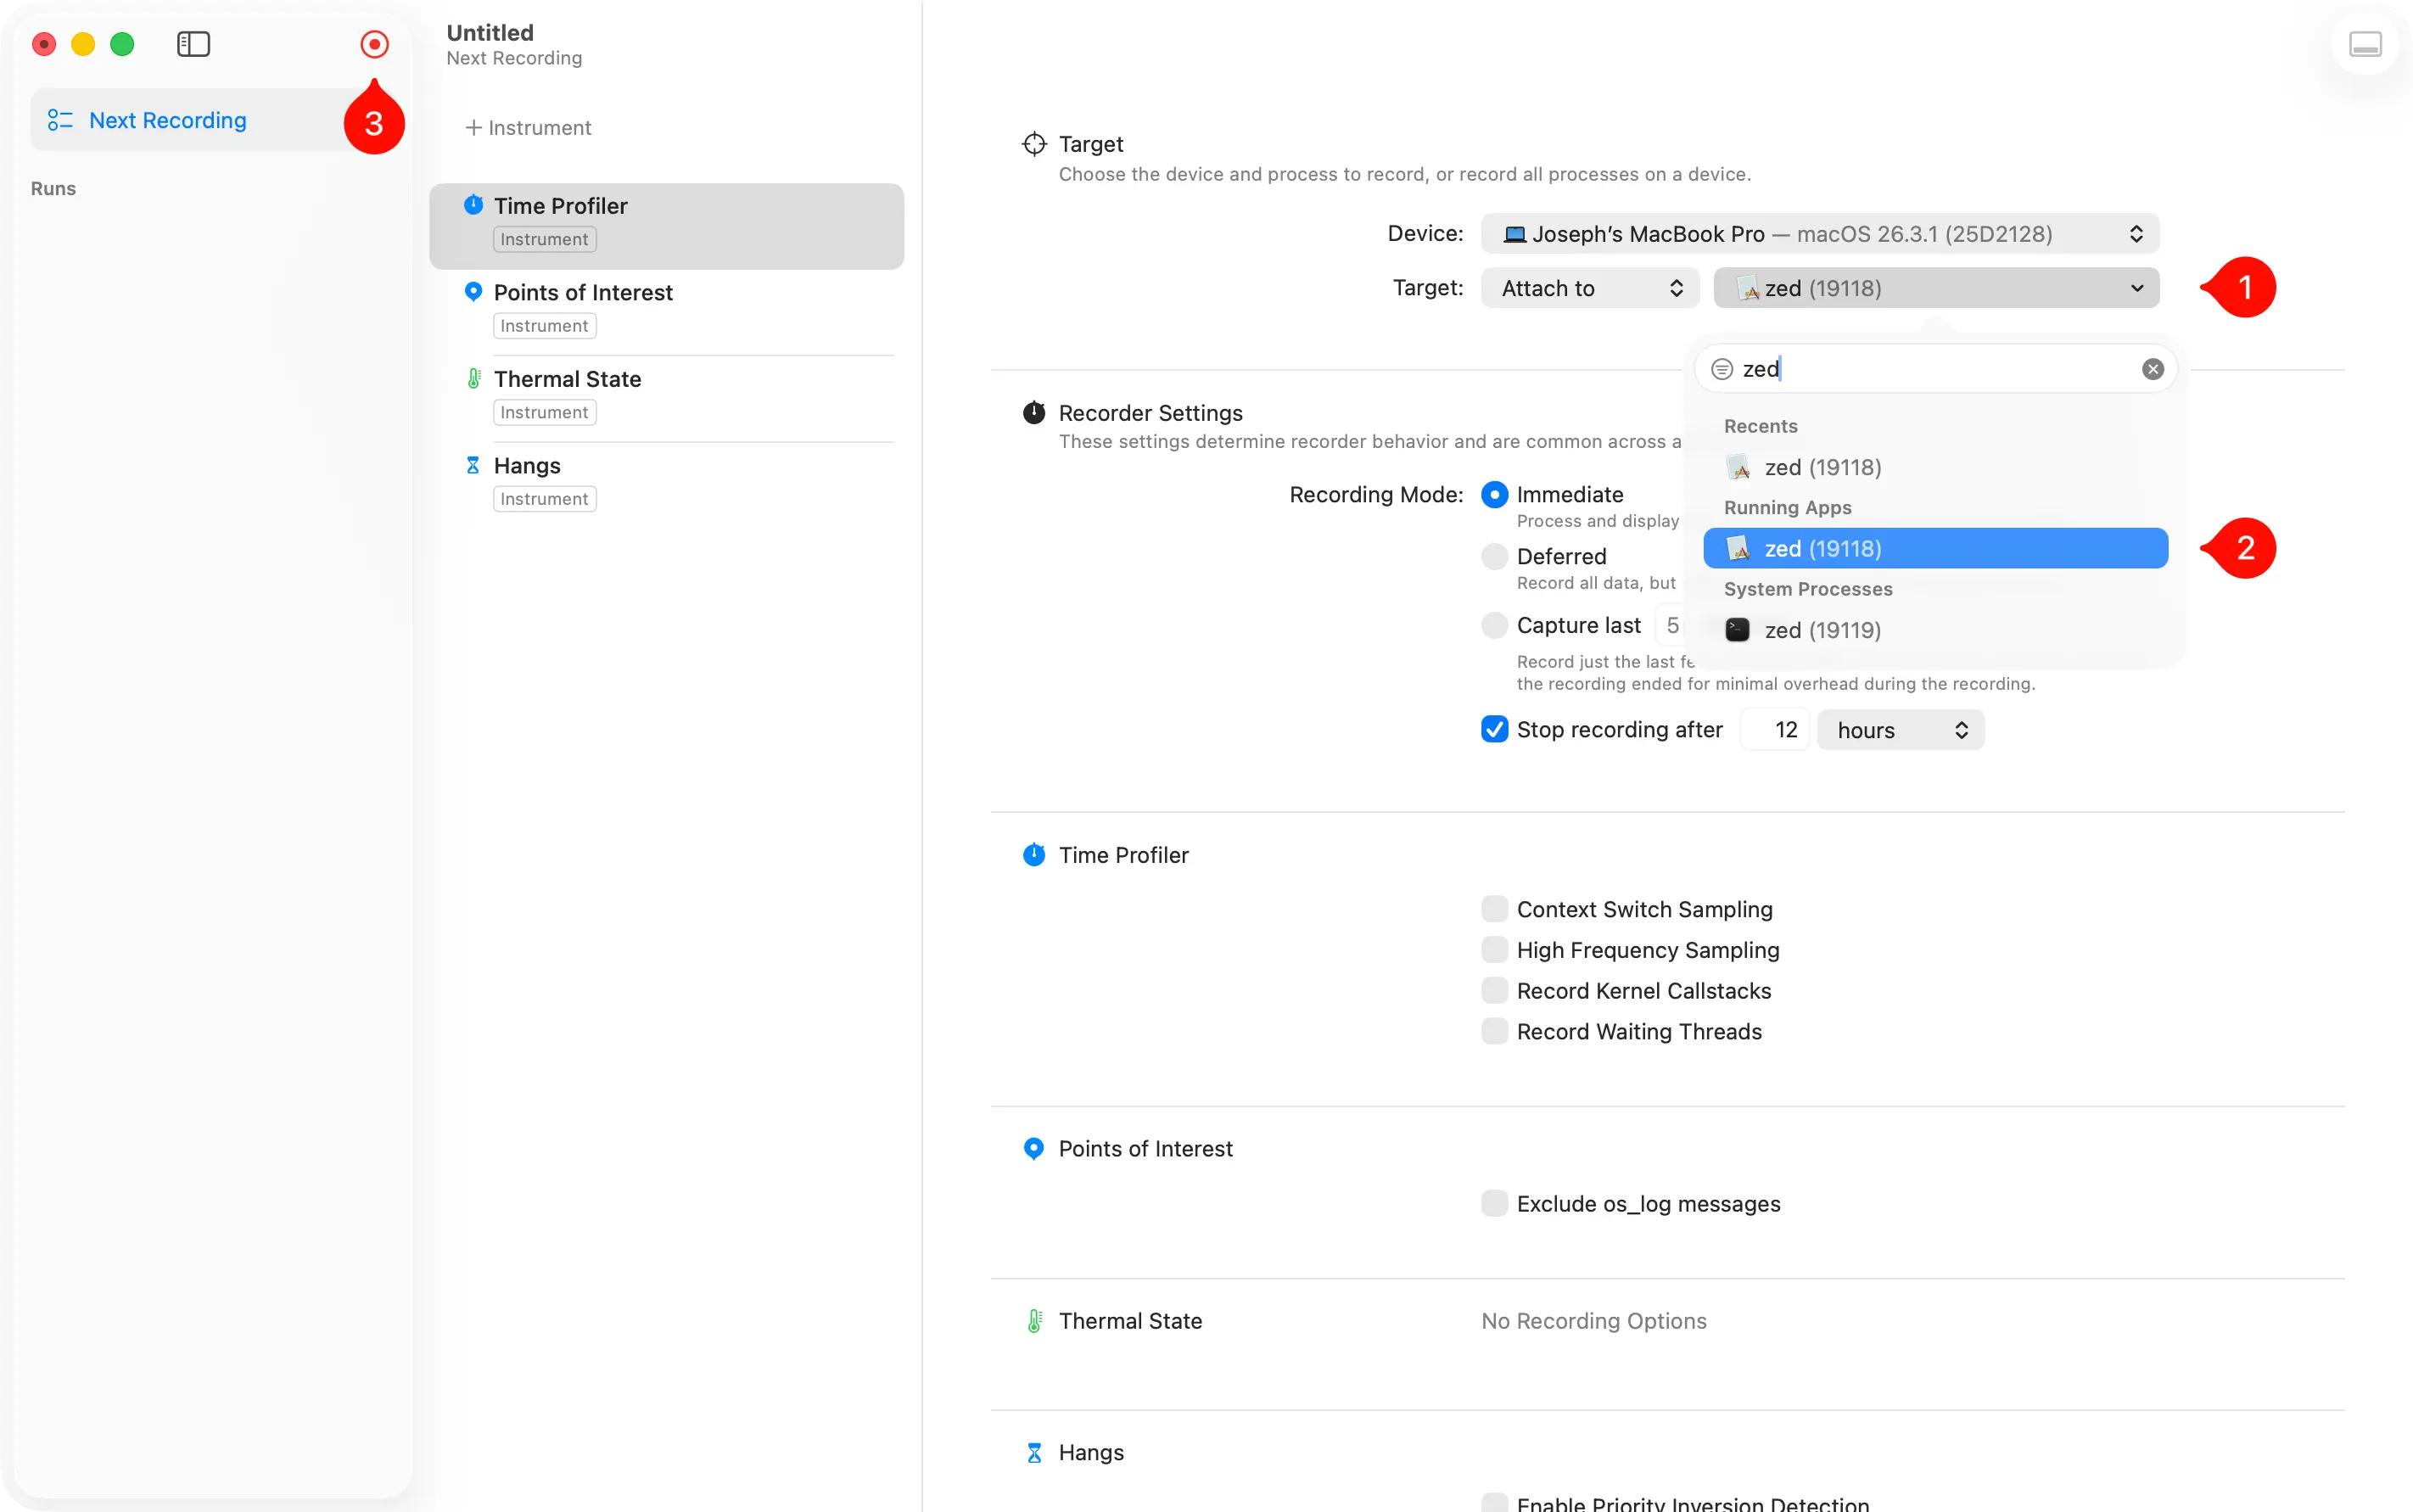
- In the
Time Profilerconfiguration, set the target to the running Zed process - Start recording
- Perform the action in Zed that causes performance issues
- Stop recording
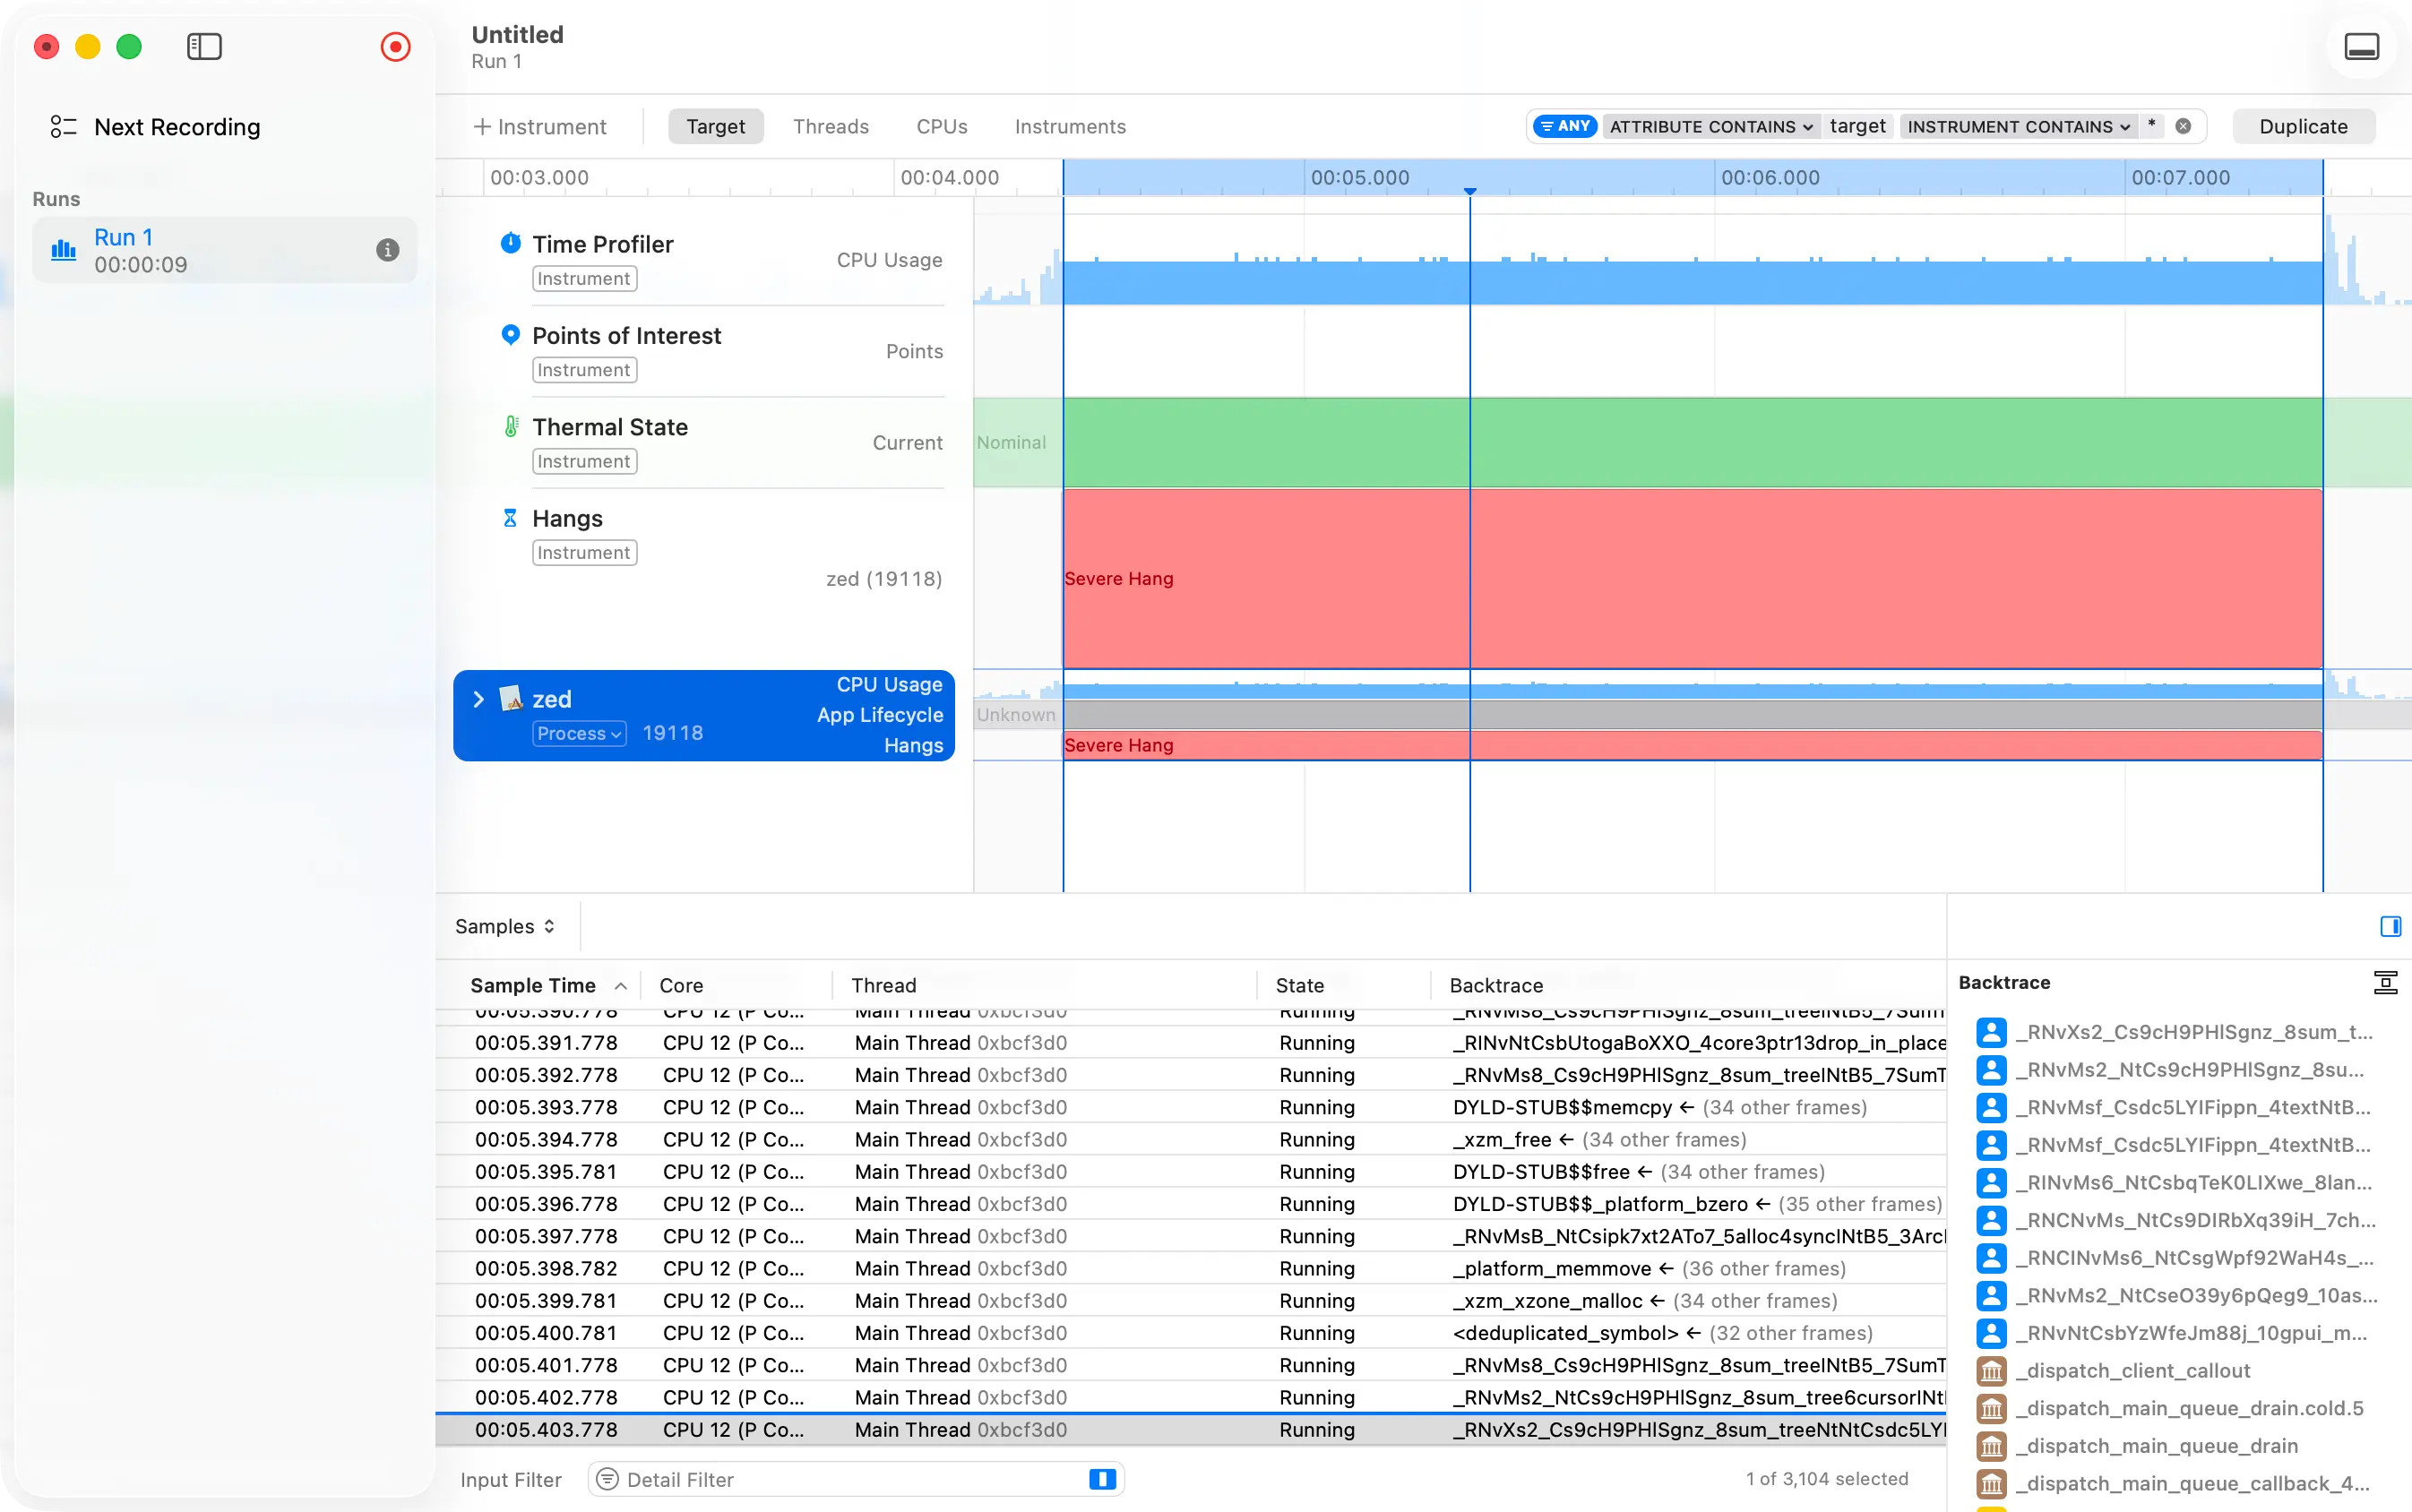
- Save the trace file
- Compress the trace file into a zip archive
- File a GitHub issue with the trace zip attached
Startup and Workspace Issues
Zed creates local SQLite databases to persist data relating to its workspace and your projects. These databases store, for instance, the tabs and panes you have open in a project, the scroll position of each open file, the list of all projects you've opened (for the recent projects modal picker), etc. You can find and explore these databases in the following locations:
- macOS:
~/Library/Application Support/Zed/db - Linux and FreeBSD:
~/.local/share/zed/db(or withinXDG_DATA_HOMEorFLATPAK_XDG_DATA_HOME) - Windows:
%LOCALAPPDATA%\Zed\db
The naming convention of these databases takes on the form of 0-<zed_channel>:
- Stable:
0-stable - Preview:
0-preview - Nightly:
0-nightly - Dev:
0-dev
While rare, we've seen a few cases where workspace databases became corrupted, which prevented Zed from starting. If you're experiencing startup issues, you can test whether it's workspace-related by temporarily moving the database from its location, then trying to start Zed again.
Note: Moving the workspace database will cause Zed to create a fresh one. Your recent projects, open tabs, etc. will be reset to "factory".
If your issue persists after regenerating the database, please file an issue.
Language Server Issues
If you're experiencing language-server related issues, such as stale diagnostics or issues jumping to definitions, restarting the language server via editor: restart language server from the command palette will often resolve the issue.
Agent Error Messages
"Max tokens reached"
You see this error when the agent's response exceeds the model's maximum token limit. This happens when:
- The agent generates an extremely long response
- The conversation context plus the response exceeds the model's capacity
- Tool outputs are large and consume the available token budget
To resolve this:
- Start a new thread to reduce context size
- Use a model with a larger token limit in AI settings
- Break your request into smaller, focused tasks
- Clear tool outputs or previous messages using the thread controls
The token limit varies by model—check your model provider's documentation for specific limits.